- Bağlantıyı al
- X
- E-posta
- Diğer Uygulamalar
ggplot(data=mpg)+ geom_point(mapping=aes(x=displ,y=hwy))

ggplot(data=mpg)+ geom_point(mapping=aes(x=displ,y=hwy, color=class))

ggplot(subset(mpg, class == "compact"), aes(displ, hwy)) + geom_point()

ggplot(subset(mpg, year==2008), aes(displ, hwy)) + geom_point()

ggplot(data = mpg) + geom_point(mapping = aes(x = displ, y = hwy)) + facet_wrap(~ class, nrow = 2)

ggplot(data = mpg) + geom_point(mapping = aes(x = displ, y = hwy)) + facet_grid(drv ~ cyl)

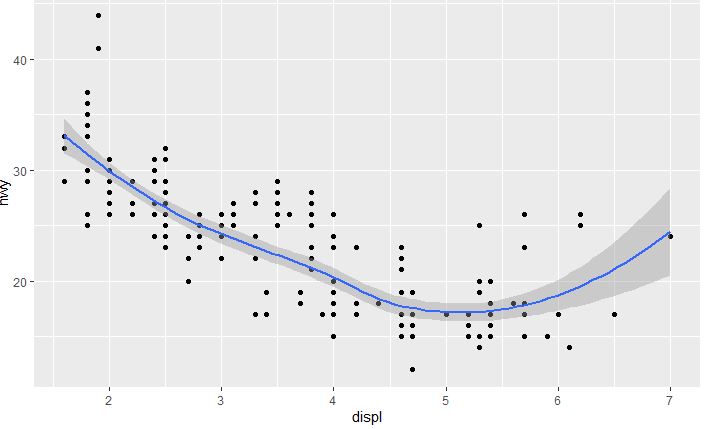
ggplot(data = mpg) + geom_smooth(mapping = aes(x = displ, y = hwy))

ggplot(data = mpg) + geom_smooth(mapping = aes(x = displ, y = hwy, linetype = drv))

ggplot(data = mpg, mapping = aes(x = displ, y = hwy)) + geom_point() +geom_smooth()
ggplot(data = mpg, mapping = aes(x = displ, y = hwy)) + geom_point(mapping = aes(color = class)) +
geom_smooth()

ggplot(data = mpg, mapping = aes(x = displ, y = hwy)) +
geom_point(mapping = aes(color = class)) +
geom_smooth(
data = filter(mpg, class == "subcompact"),
se = FALSE
)
ggplot(data = mpg, mapping = aes(x = displ, y = hwy)) +
geom_smooth(
data = filter(mpg, class == "subcompact"),
se = FALSE
)
ggplot(data = mpg, mapping = aes(x = displ, y = hwy)) +
geom_point(
data = filter(mpg, class == "subcompact"),
)
.................................................................
ggplot(data=diamonds)+ geom_bar(mapping = aes(x=cut))
ggplot(data = diamonds) + stat_count(mapping = aes(x = cut))

ggplot(data = diamonds) + geom_bar (mapping = aes(x = cut, y = ..prop.., group = 1))

ggplot(data = diamonds) + stat_summary( mapping = aes(x = cut, y = depth),
fun.ymin = min,
fun.ymax = max,
fun.y = median
)

ggplot(data = diamonds) + stat_summary( mapping = aes(x = cut, y = depth),
fun.y = median
)

ggplot(data = diamonds) + geom_bar(mapping = aes(x = cut, fill = cut))

ggplot(data=diamonds)+geom_bar(mapping = aes(x=cut, fill=clarity))

ggplot(data = diamonds) + geom_bar( mapping = aes(x = cut, fill = clarity), position = "fill")

ggplot(data = diamonds) + geom_bar( mapping = aes(x = cut, fill = clarity), position = "dodge")

?position_dodge, ?position_fill, ?position_identity, ?position_jitter, and ?position_stack.
Yorumlar
Yorum Gönder